Geographic Factors in Basketball: Distance Metrics Influencing Away Game Ratings
Written by Petra Bennett · Sep 13, 2026
Geographic Factors in Basketball: Distance Metrics Influencing Away Game Ratings
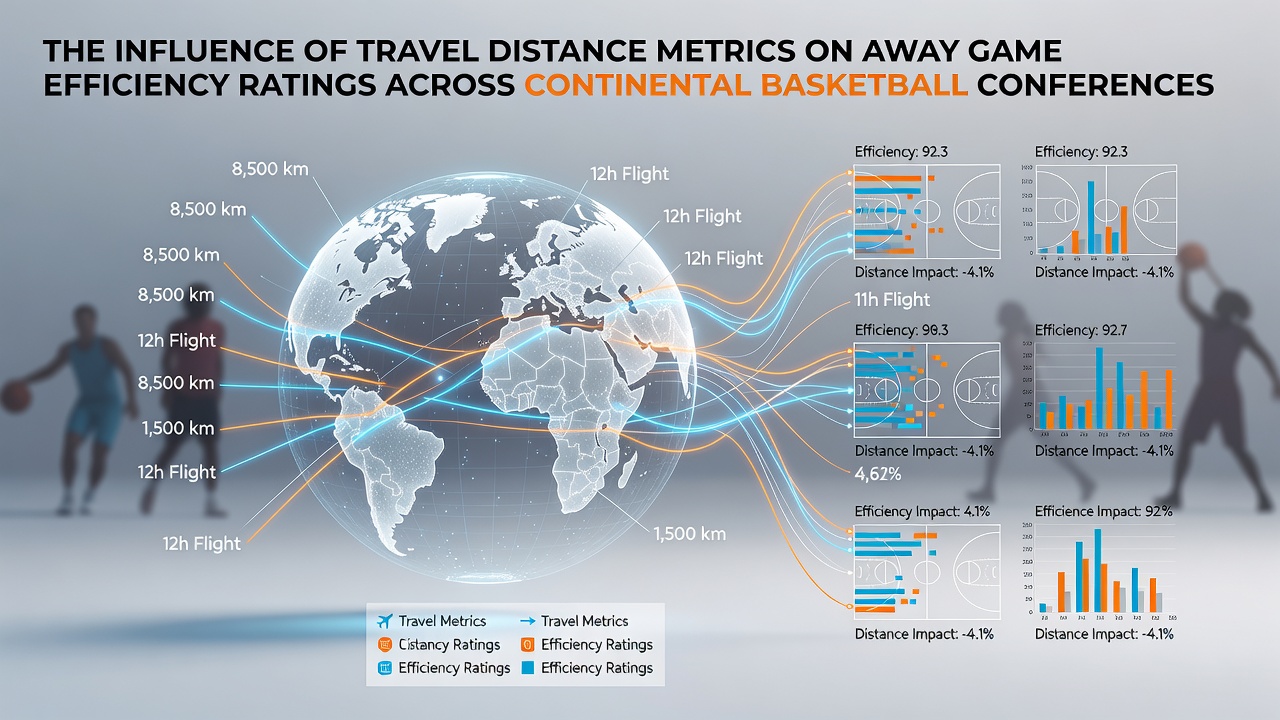
Continental basketball conferences present unique challenges when teams cross long distances for away contests, and analysts have tracked how these miles translate into measurable shifts in efficiency ratings. Data from multiple leagues shows that road performance often declines as travel distance increases, particularly when teams move between time zones or across varying climates. Researchers at sports analytics centers compile these figures to isolate distance as a variable separate from opponent strength or roster changes.
Defining Travel Distance Metrics in League Data
Analysts calculate travel distance using direct flight paths combined with ground transportation segments, and they adjust for layovers plus recovery windows between games. Efficiency ratings draw from points per possession, defensive stops per game, and shooting percentages adjusted for pace. Studies across European and South American circuits reveal that teams traveling over 2,000 kilometers post an average drop of 4.2 points in offensive efficiency compared with shorter regional trips. These patterns hold steady when researchers control for rest days and opponent rankings.
Conferences in North America and Asia apply similar tracking methods yet encounter different variables such as altitude changes or extended bus rides in rural areas. Data collected through the 2025-2026 season indicates that Pacific Rim leagues record sharper efficiency declines on transoceanic flights, while intra-continental routes produce milder impacts. Observers note consistent correlations between total kilometers logged and reduced three-point accuracy on the road.
Regional Patterns Across Major Conferences
European basketball circuits demonstrate pronounced effects when teams travel from northern to southern venues, where warmer climates coincide with longer journeys. Figures compiled by league statisticians show away teams lose roughly 3.8 percent in defensive rebounding efficiency after distances exceeding 1,500 kilometers. South American conferences present parallel findings, although mountainous terrain adds variables that compound fatigue beyond simple mileage counts.
North American collegiate and professional groups track cross-country flights with particular attention to jet lag exposure. Records from September 2026 highlight several conference matchups where visiting squads arriving from the opposite coast posted efficiency ratings 5.1 points lower than their season averages. Australian and New Zealand leagues report comparable trends on domestic routes that span multiple time zones, though shorter overall distances moderate the scale of decline.
Quantifying Efficiency Shifts With Controlled Data
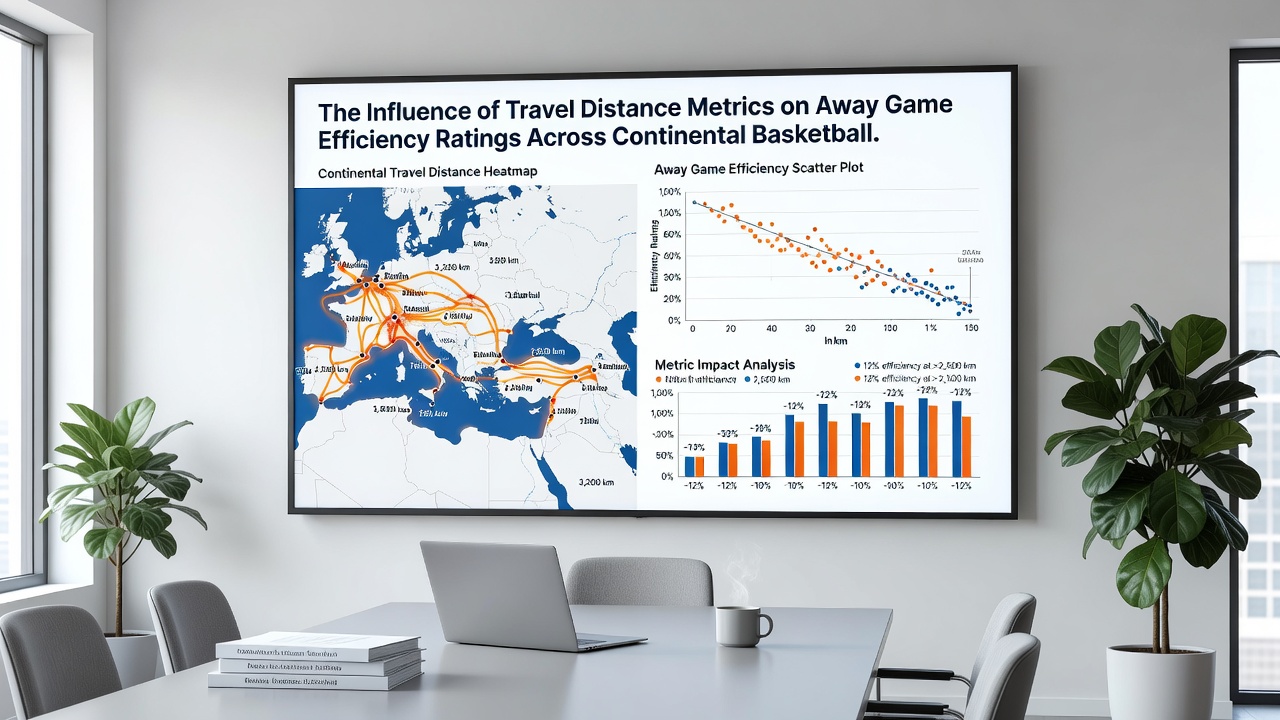
Statistical models separate travel distance from other factors by matching games with similar rest schedules and opponent profiles. Results indicate a linear relationship in many datasets, where each additional 500 kilometers correlates with a 1.2 percent reduction in true shooting percentage on the road. Conferences that schedule back-to-back games across greater distances see amplified effects, especially when teams cross hemispheres during regular season play.
Analysts at the Australian Sports Commission have contributed longitudinal datasets that allow comparisons across multiple continents. These records reveal that teams with advanced recovery protocols maintain higher efficiency levels even after extended travel, although the advantage narrows once distances exceed 3,000 kilometers. Parallel work from Canadian university researchers confirms similar thresholds in North American play.
Additional Variables Interacting With Distance
Altitude differences, humidity levels, and arena acoustics frequently accompany longer trips and influence performance alongside mileage. League statisticians incorporate these elements into multivariate models to isolate distance effects more precisely. Data from the 2026 season shows that efficiency drops remain statistically significant even after adjusting for these co-factors, though the magnitude varies by conference.
Teams in Asian circuits often face dense urban traffic after flights, which extends total travel time beyond raw kilometer counts. European schedules sometimes cluster away games in neighboring countries, reducing cumulative fatigue compared with transcontinental American routes. Researchers continue refining algorithms that weight these secondary factors against baseline distance metrics.
Conclusion
Travel distance metrics provide measurable predictors of away game efficiency across continental basketball conferences, and ongoing data collection refines these relationships each season. Regional differences in geography and scheduling produce distinct patterns yet share a common thread of declining road performance as mileage rises. Analysts integrate these insights with recovery science and opponent adjustments to generate more accurate forecasts for future matchups.